By place
This page includes interactive search, maps and virtual reality. See also maps page and Datavisualization, as well as Africa, also Asia China,, and Europe as well as India, California, and Latin America. New page: (An-)Arctica.
Contents
General
Environment of California wikipedia. Pollution, Superfund toxic sites, Climate Change, CalEPA, CA green activist organizations.
UCSC Atlas of Global Inequality **** BOOK The atlas of global inequalities by UCSC profs Crow, Ben.; Lodha, Suresh K. 2011 McHenry Library General Collection HM821 .C76 2011
North American Environmental Atlas
Timelapse: glacier retreat is just one of the many stunning phenomena that can be observed using the tools of the recently launched Timelapse project. In conjunction with the U.S. Geological Survey, NASA and TIME, Google released millions of satellite images that cover a quarter century.
Environmental maps Lots of resources here.
Gapminder has astonishing info by country, over time, and the ability to do comparisons. See truly excellent TEDtalks. ****
Town Charts appears to be used by people to look at different aspects of US, for example, income inequality in SF or demographics.***
Parag Khanna maps the future of countries (TEDtalk video).
Cal-Adapt was built specifically to address projections about climate change in California, designed by Google, in collaboration with the California Energy Commission, the U.S. Geological Survey, several California universities and others. NEW
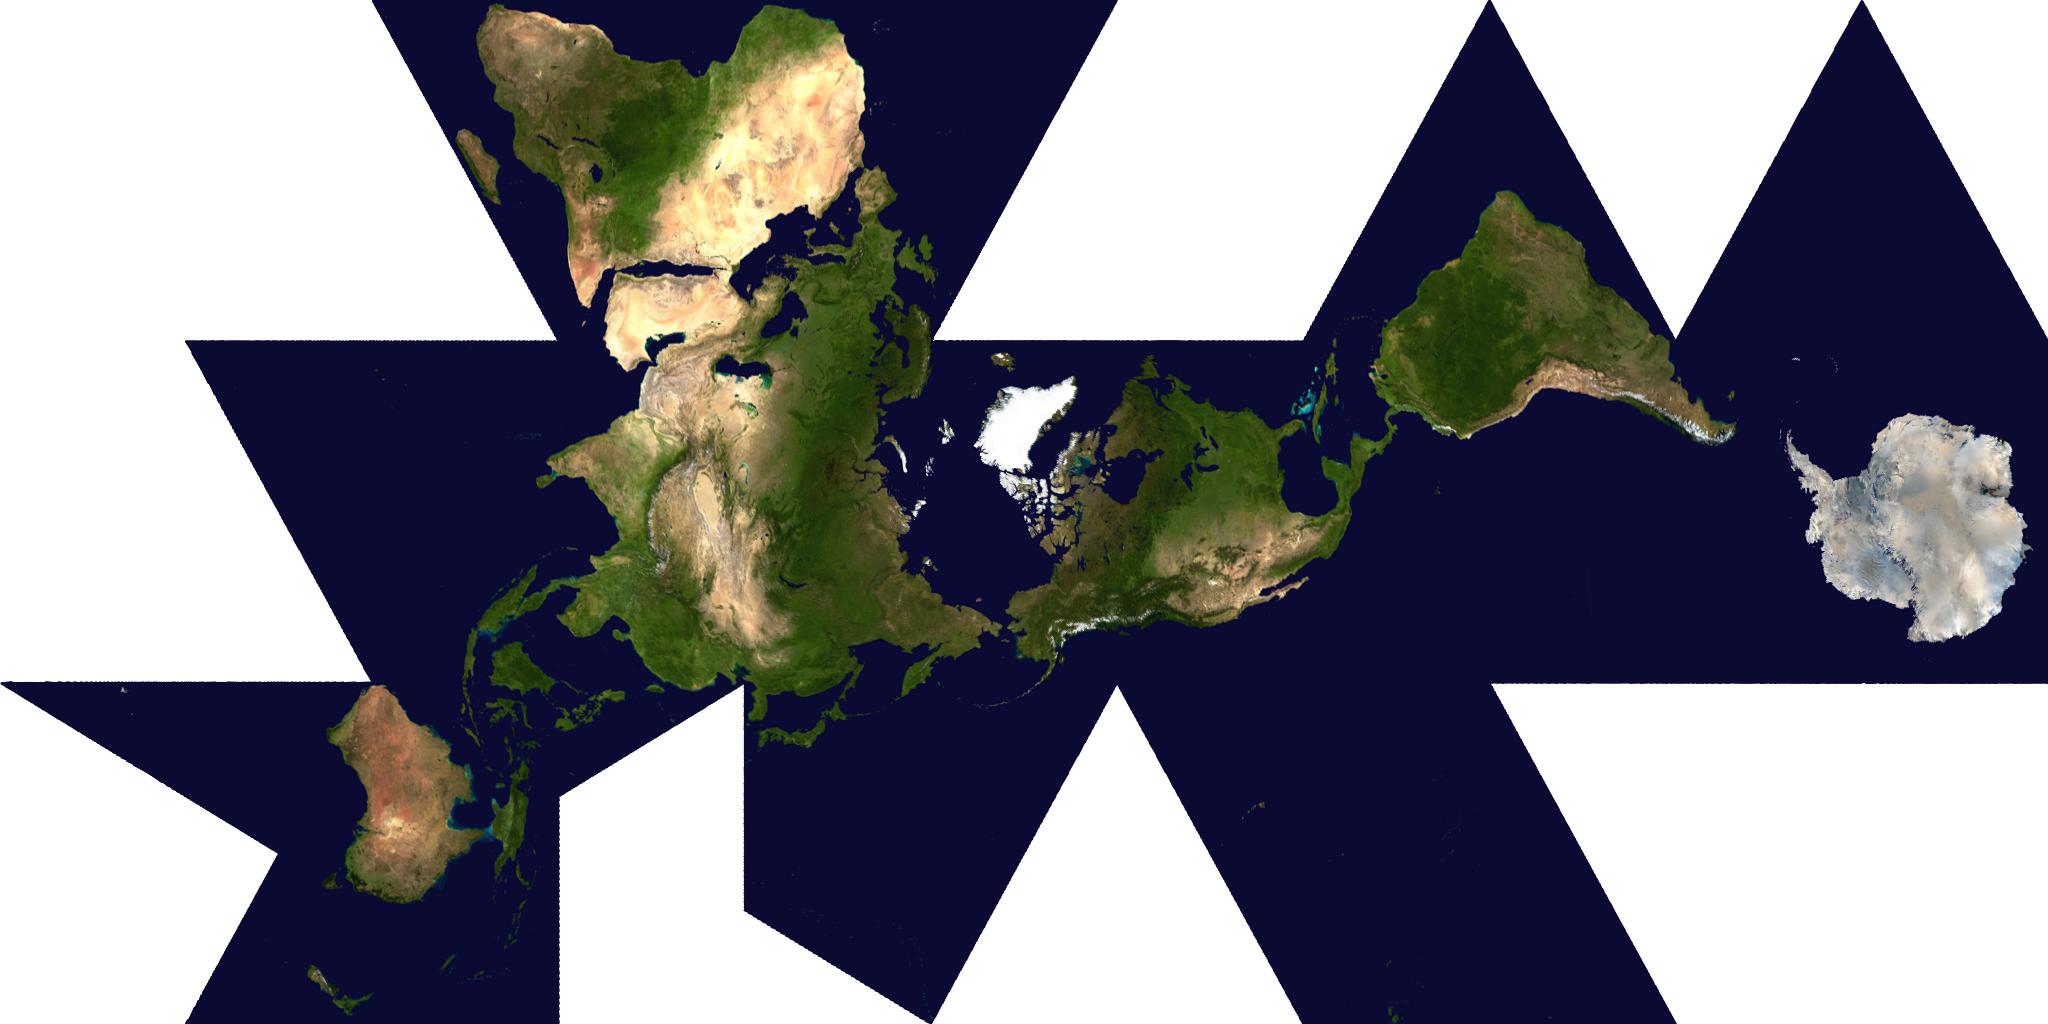
Dymaxian map by Buckminster Fuller Large
New 3D earth images11/10
New high Res earth images from NASA 1/12
Earth at night more NASA Earth from space (video). 4/13
Satellite images at night show changes more images/video. 2/12 Earth at night update 12/12.
The most and least remote places in the world. Surprisingly less than 10% of the world's land is more than 48 hours of ground-based travel from the nearest city. Amazon? Two days.
New 3D maps from new satellites.
Representing Earth is an NYU course that investigates the potential of recreating the earth in images, VR etc.
Blaise Agüera y Arcas is the architect of Bing Maps at Microsoft, building augmented reality into searchable maps. He's also the co-creator of Photosynth, software that assembles static photos into a synergy of zoomable, navigatable spaces.
Currently mostly San Franciso Bay Area content
Care2 gives various kinds of eco and demographic info based on geography.
If the world's population lived in one city (different densities).
US Population density relative to world in terms of rail.
Open Greenmap a collective effort to show eco-info. A related concept is using maps for crises, as was done in Haiti. An extension of that is peace-mapping. Related: Safecast is open source crowd-sharing site for tracking radiation in Japan, but could be expanded.
Books about maps (not necessarily green) at Amazon including Radical Cartography andYou Are Here: Personal Geographies and Other Maps of the Imagination
Else/where : mapping new cartographies of networks and territories / Janet Abrams + Peter Hall, editors Minneapolis, MN : University of Minnesota Design Institute : Distributed by University of Minnesota Press, c2006 View contents online S&E Stacks GA139 .E48 2006
10 Most endangered places in American South.
US map of hate speech on Twitter.
The Harrisons showed their eco-maps at UCSC.
Bio-Diversity
See also Bio-diversity Page and Wildlife.
Atlas for the End of the World (article); link 4/17.
Interactive Map Shows Which States Kill the Most Black Bears, Mountain Lions, Wolves and Bobcats 8/16, see
New Map of Life, interactive of 25K species. See also.
A New Map of the World’s Ecosystems 1/15.
Hotspots from WWF.another version. See Bio-Diversity.
Center for Biological Diversity map of endangered species in US.
National Geographic has biome map and one of 200 hotspots designated by WWF.org.
Mannahatta Project. Eric Sanderson pictures New York -- before the City. 400 years after Hudson found New York harbor, Sanderson shares how he made a 3D map of Mannahatta's fascinating pre-city ecology of hills, rivers, wildlife -- accurate down to the block -- when Times Square was a wetland and you couldn't get delivery. TEDtalk video.
eNature allows you to identify, track and report wildlife in your area.
Google Earth Endangered Species requires download.
Google unveils Street View imagery from Antarctica, including South Pole Telescope, Shackleton sites. 7.12
Chemicals
California pollution maps CalEnviroScreen by CalEPA 10/18.
ToxMap shows toxic waste sites in US ***
Poisoned Places four part NPR report and interactive map. 11/11
Scorecard.org allows you to see environmental hazards by maps or Zip code ****
Mapcruzin by Slug Mike Meuser *** South Bay map, SF Bay cumulative exposures, contaminated Bay Area groundwater.
SkyTruth uses remote sensing and digital mapping to educate the public and policymakers about the environmental consequences of human activities, and to hold corporations and governments to higher standards of accountability around the globe. This link is to Gulf Oil Spill. They also have an interactive tool, Spill Tracker. See also fishing trawler sediment trails and oil sands.
ToxicRisk.com - Mashup Combines recent EPA Toxic Release Inventory data (03/19/2009), school locations and chemical release information with Google Maps to help you locate potentially risky toxic facilities in your community where you live, work and play and where your children go to school.
China pollution maps (air and water).
Petrochemical America explores Louisiana's Cancer Alley, among other places; includes maps and infographics. samples Kate Orff
5 worst US cities for pollution 11/13.
Consumption/Resources/Food
Sourcemap is an open source project about where things come from. You can add maps and info.
Worldmapper *** Very cool; shows how different countries produce and consume etc by changing relative size.
Walkscore.com tells you how walkable a neighborhood is.
Food Insecurity (hunger) in US by state/county.
Watch the spread of Wal-marts.
Economics
See also Economics Page
Gapminder has astonishing info by country, over time, and the ability to do comparisons. See truly excellent TEDtalks.
How climate change will affect migration in Mexico, in India, in Viet Nam, and in Egypt. See full UN report.
BOOK The atlas of global inequalities by UCSC profs Crow, Ben.; Lodha, Suresh K. 2011 McHenry Library General Collection HM821 .C76 2011
Political corruption world map.
Energy
See also Energy Page
U.S. Energy Information Administration (EIA) is introducing interactive maps of energy (mines, powerplants etc) that combine real-time data feeds from NOAA's National Hurricane Center, video demo TRMS) 2/14.
Solar Incentive US map, Oregon's pilots of a solar highway (and other useful graphs and info).
Prospecting for wind (video).
U.S. map showing installations of non-hydro renewable energy in 1970 compared to today.
Time lapse images of mountaintop coal removal.
Wind Map tells where it's feasible to use it as a power source.
State-by-State Guide to Information on Coal in the United States
Petrochemical America explores Louisiana's Cancer Alley, among other places; includes maps and infographics. samples Kate Orff.
Trains in US includes infographic map.
Food
See also Food Page
USDA Food Atlas Find good food by place via Eatwell Guide, see also another tool Eat Local shops where to get local food and how to get there. Know your farmer.
A tool that maps and grades "food deserts" to lure supermarkets. USDA version. New Food Desert map 3/13.
Food Insecurity (hunger) in US by state/county.
A tool that maps and grades "food deserts" to lure supermarkets. USDA version.
World food map from CIR.
Forests
Real-time deforestation map by Google and WRI (goes back 14 years).
NYT interactive map 10/11
Google Earth alt link direct.
urban tree map of San Francisco, is part of larger open data initiative that helps with mass transit and recycling by providing mobile apps.
First-of-its-Kind Map Depicts Global Forest Heights
You can identify poor neighborhoods from space.
urban tree map of San Francisco, is part of larger open data initiative that helps with mass transit and recycling by providing mobile apps.
First-of-its-Kind Map Depicts Global Forest Heights.
New map shows how gold-obsessed libertarians are screwing up the rainforest.
Fires
See Fire
Forged in Fire: California’s Lessons for a Green New Deal by Naomi Klein 11/19.
Fire Tracker SF Chronicle 11/18.
U.S. Wildfire Interactive Shows Rising Temperatures, Less Snowfall Are Leading To More Fires infographic 7/13.
Global map 11/18
Three realtime maps 11/18
Cal Fire map 11/18.
Global Warming/Air Pollution
Climate Central has various tools e.g., sea level rise maps (Enter a location you are curious about) 11/19.
Trump Wants to Eliminate NASA’s Climate Research Programs: These Pictures Show What a Loss That Would Be: Excellent update, overview with NASA images and graphs 3/18.
NASA Produces First 3D Animation of Global Carbon Emissions 12/16.
WORLD’S FIRST GLOBAL REAL-TIME AIR POLLUTION MAP AND APP LAUNCHED 12/15. Berkeley 11/17.
Check out some of the prettiest (and most depressing) climate change data out there. 10/15.
Thanks to shrinking sea ice, National Geographic puts global warming on the map literally. 6/14.
1st NASA CO2 map 12/14. NASA carbon map. animated video.
Interactive Map Shows How Hot Your City Will Be in 2100 7/14.
Check the climate forecast in your county new USGS tool. NEW 12/13.
New Google climate map initiative with the Obama Administration 3/14.
Google Earth GIFs, 'Timelapse' Project, Show Startling Impact Of Humans On The Planet, including ice loss 5/13.
Biggest COs emissions countries 11/13.
Interactive maps on temperature increase
U.S. Wildfires: Burn Area Expected To Double By 2050 12/12.
Interactive Global Warming maps from Union of Concerned Scientists. NEW!
New map shows 4 of 5 Americans affected by climate disasters 2/12
NASA visualization of temperature change since 1880. 1/12
CAKE map of projects adapting to climate change. CAKE is a joint project of Island Press (Slug!) and EcoAdapt (even more Slugs: Lara Hansen and Eric Mielbrecht). It is aimed at building a shared knowledge base for managing natural systems in the face of rapid climate change.
How climate change will affect migration in Mexico, in India, in Viet Nam, and in Egypt. See full UN report.
Cal-Adapt was built specifically to address projections about climate change in California, designed by Google, in collaboration with the California Energy Commission, the U.S. Geological Survey, several California universities and others.
Rising Ocean Levels interactive maps.
UN map of Africa showing effects of Global Warming. Atlas see Africa page.
Google Earth Climate Change maps.
California status and map 2/12.
California's Top Polluters (map)
EPA Criteria Pollutants - (Google Earth )Mapped by facility and tons of criteria pollutants released to the air. Criteria pollutants include carbon monoxide, nitrogen oxides, sulfur dioxide, volatile organic compounds, particulate matter < 10 micrometers, particulate matter < 2.5 micrometers. From Mike Meuser, Slug.
Google unveils Street View imagery from Antarctica, including South Pole Telescope, Shackleton sites. 7.12
Water
Drought map. Drought update, CA water history overview 4/17 ***audio interview with The Atlas of California: Mapping the Challenge of a New Era Richard A. Walker (UCB), Suresh K. Lodha (UCSC).
What's in your Water?. On World Water Day, the World Resources Institute (WRI) has released a study that maps for the first time the water resources available to support fracking in the world’s largest shale exploration areas. 9/14.
Where does your water come from?.
Land and water grabs in developing Third World countries 1/13.
Saving the Bay is an amzing four hour PBS KQED documentary. sample on mercury from the Gold Rush. ***
Delta: The Sierra Club has questions about the Sacramento Delta water. maps. Commonwealth Club(audio) held a panel discussion(video) 10/13.
Ocean
Santa Cruz Watershed info map.
Effect of XL pipeline spill 7/14.
Plastic gyres see also Plastic 7/14.
Rising Ocean Levels interactive maps.
EcoTrust is a web-based environment for making decisions about the best economic and ecological uses of the ocean.
Help explore the ocean floor. The HabCam team and the Woods Hole Oceanographic Institution need your help! 9/12.
Sylvia Earle on Google Earth 5 mapping the oceans. Interview here's a sample
Interactive map of marine dead zones
Whale ship collision map Boston shows how these could be avoided.
Coral reef watch in Google Earth. Google Launches Street View Underwater.
Google Earth/3D
Timelapse: glacier retreat is just one of the many stunning phenomena that can be observed using the tools of the recently launched Timelapse project. In conjunction with the U.S. Geological Survey, NASA and TIME, Google released millions of satellite images that cover a quarter century. 4/14.
New Google climate map initiative with the Obama Administration 3/14.
Google Earth allows you to fly over a globe and look at information people have posted. The software is free, but you need reasonable graphics on your computer to run it.
Google Street View Takes You To Gombe National Park, Home Of Jane Goodall's Chimpanzees see wildlife and eco-heroes.
You Can Apply to Use Google's Street View Backpack Now 7/13.
Google Earth GIFs, 'Timelapse' Project, Show Startling Impact Of Humans On The Planet, including ice loss 5/13.
UCSC Ecology Dept is using Google Earth to map research on Bristlecone Pine.
Cal-Adapt was built specifically to address projections about climate change in California, designed by Google, in collaboration with the California Energy Commission, the U.S. Geological Survey, several California universities and others.
Google Earth Engine is an online environment monitoring platform that makes available to the entire world a dynamic digital model of our planet that is updated daily. It stores petabytes of satellite data and allows high-performance tools to analyze and interpret this information that can then be visualized on a map, ranging from rainforest changes in the Amazon to water resources in the Congo.
List of many eco sites using GE ***
Endangered Species requires download.
EPA Criteria Pollutants - (Google Earth )Mapped by facility and tons of criteria pollutants released to the air. Criteria pollutants include carbon monoxide, nitrogen oxides, sulfur dioxide, volatile organic compounds, particulate matter < 10 micrometers, particulate matter < 2.5 micrometers. From Mike Meuser, Slug.
Investigate climate change via Google EarthGoogle Earth guided tour of global warming impacts.
Google Earth stops mountaintop removal
North American Environmental Atlas uses various tools, including Google Earth.
Google Earth map of endangered species
UN Google Earth maps of global climate change and its effects
Google Earth maps of Appalachian mountaintop removal in coal mining
Jane Goodall's work with chimpanzees
Coral reef watch Google Launches Street View Underwater.
20 Stunning Photos of Google’s Underwater Street View
New Google climate map initiative with the Obama Administration 3/14.
New Google Earth map with an interactive animation showing how climate change and global temperature rises could affect our world over the next 100 years. The Google Earth Timelapse Guide to a Changing Planet.
Google Earth stops mountaintop removal.
California
Environment of California wikipedia. Pollution, Superfund toxic sites, Climate Change, CalEPA, CA green activist organizations.
Saving the Bay is an amzing four hour PBS KQED documentary. sample on mercury from the Gold Rush. ***
Cal-Adapt was built specifically to address projections about climate change in California, designed by Google, in collaboration with the California Energy Commission, the U.S. Geological Survey, several California universities and others. NEW
Suresh K Lodha, Computer Science, has contributed to the Atlas of Global Inequality with Ben Crow, and The Atlas of California: Mapping the challenge of a new era (2013).
UCSC
interesting 1973 map/guide of UCSC campus pointing out historical and natural sites.
We make maps at UCSC at the The Center for Integrated Spatial Research (CISR), formerly the GIS/ISC Laboratory, is the central facility for spatially-focused research and training at the University of California, Santa Cruz. CISR is focused on integrating state-of-of-the-art spatial technology and methods (geographic information systems, global positioning systems, remote sensing, spatial modeling/statistics) with pressing interdisciplinary research and fostering cross-domain cooperation in the application of these tools., for example of The Farm