Difference between revisions of "By place"
m |
m |
||
| Line 107: | Line 107: | ||
[[Category:Chemicals]] | [[Category:Chemicals]] | ||
[[Category:China]] | [[Category:China]] | ||
| + | [[Category:Consumption]] | ||
[[Category:Energy]] | [[Category:Energy]] | ||
[[Category:Food]] | [[Category:Food]] | ||
| Line 113: | Line 114: | ||
[[Category:Geographical Information Systems]] | [[Category:Geographical Information Systems]] | ||
[[Category:Global Warming]] | [[Category:Global Warming]] | ||
| + | [[Category:Ocean]] | ||
[[Category:Wildlife]] | [[Category:Wildlife]] | ||
[[Category:Wind]] | [[Category:Wind]] | ||
Revision as of 16:06, 26 April 2010
Scorecard.org allows you to see environmental hazards by maps or Zip code ****
Sourcemap is an open source project about where things come from. You can add maps and info.
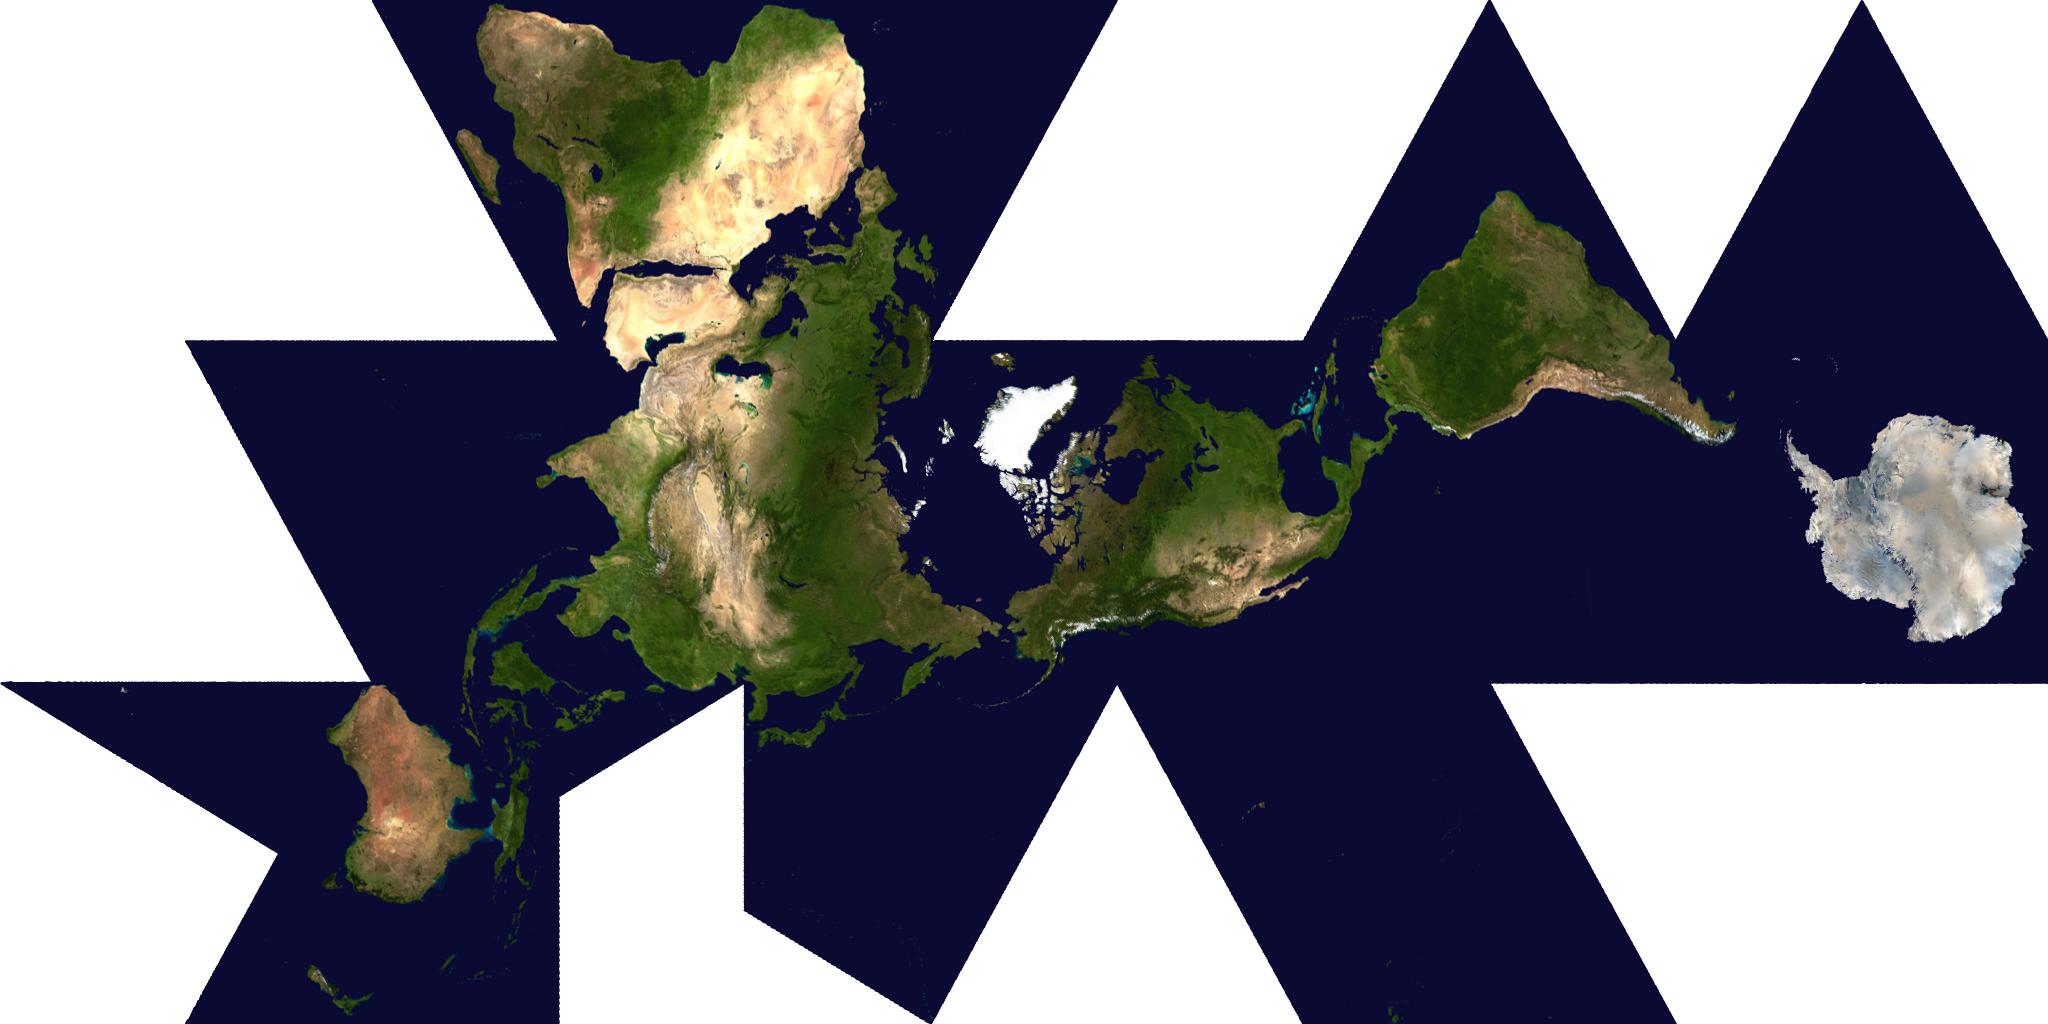
Worldmapper *** Very cool; shows how different countries produce and consume etc by changing relative size.
ToxMap shows toxic waste sites in US ***
UCSC Atlas of Global Inequality ****
Mapcruzin by Slug Mike Meuser ***
North American Environmental Atlas NEW!
Dymaxian map by Buckminster Fuller Large
Solar Incentive US map, Oregon's pilots of a solar highway (and other useful graphs and info)
The most and least remote places in the world. Surprisingly less than 10% of the world's land is more than 48 hours of ground-based travel from the nearest city. Amazon? Two days.
How climate change will affect migration in Mexico, in India, in Viet Nam, and in Egypt. See full UN report.
Mannahatta Project. Eric Sanderson pictures New York -- before the City. 400 years after Hudson found New York harbor, Sanderson shares how he made a 3D map of Mannahatta's fascinating pre-city ecology of hills, rivers, wildlife -- accurate down to the block -- when Times Square was a wetland and you couldn't get delivery. TEDtalk video.
urban tree map of San Francisco, is part of larger open data initiative that helps with mass transit and recycling by providing mobile apps.
Find good food by place via Eatwell Guide
Walkscore.com tells you how walkable a neighborhood is.
Sourcemap is an open source project about where things come from. You can create your own maps, and add information. Other eco-maps.
Rising Ocean Levels interactive maps
Sylvia Earle on Google Earth 5 mapping the oceans. Interview here's a sample
Representing Earth is an NYU course that investigates the potential of recreating the earth in images, VR etc.
Blaise Agüera y Arcas is the architect of Bing Maps at Microsoft, building augmented reality into searchable maps. He's also the co-creator of Photosynth, software that assembles static photos into a synergy of zoomable, navigatable spaces.
Currently mostly San Franciso Bay Area content
Environmental maps Lots of resources here
eNature allows you to identify, track and report wildlife in your area
Care2 gives various kinds of eco and demographic info based on geography
Wind Map tells where it's feasible to use it as a power source
Rising Ocean Levels interactive maps
UN map of Africa showing effects of Global Warming. Atlas
Whale ship collision map Boston shows how these could be avoided
Open Greenmap a collective effort to show eco-info.
Google Earth
Google Earth allows you to fly over a globe and look at information people have posted. The software is free, but you need reasonable graphics on your computer to run it.
List of many eco sites using GE ***
Investigate climate change via Google Earth
Google Earth stops mountaintop removal
North American Environmental Atlas uses various tools, including Google Earth.
UCSC Ecology Dept is using Google Earth to map research on Bristlecone Pine.
Google Earth map of endangered species
UN Google Earth maps of global climate change and its effects
Google Earth maps of Appalachian mountaintop removal in coal mining
Jane Goodall's work with chimpanzees
California