Difference between revisions of "By place"
m |
m |
||
| Line 1: | Line 1: | ||
| − | This page includes interactive search, maps and virtual reality. See also [http://www.ic.ucsc.edu/college8core/c8wiki/index.php/Environmental_maps maps] page and [[Latin America]] | + | This page includes interactive search, maps and virtual reality. See also [http://www.ic.ucsc.edu/college8core/c8wiki/index.php/Environmental_maps maps] page and [[Latin America]] [[Datavisualization]] |
Revision as of 13:51, 22 June 2011
This page includes interactive search, maps and virtual reality. See also maps page and Latin America Datavisualization
Contents
General
UCSC Atlas of Global Inequality ****
North American Environmental Atlas
Environmental maps Lots of resources here.
Gapminder has astonishing info by country, over time, and the ability to do comparisons. See truly excellent TEDtalks.
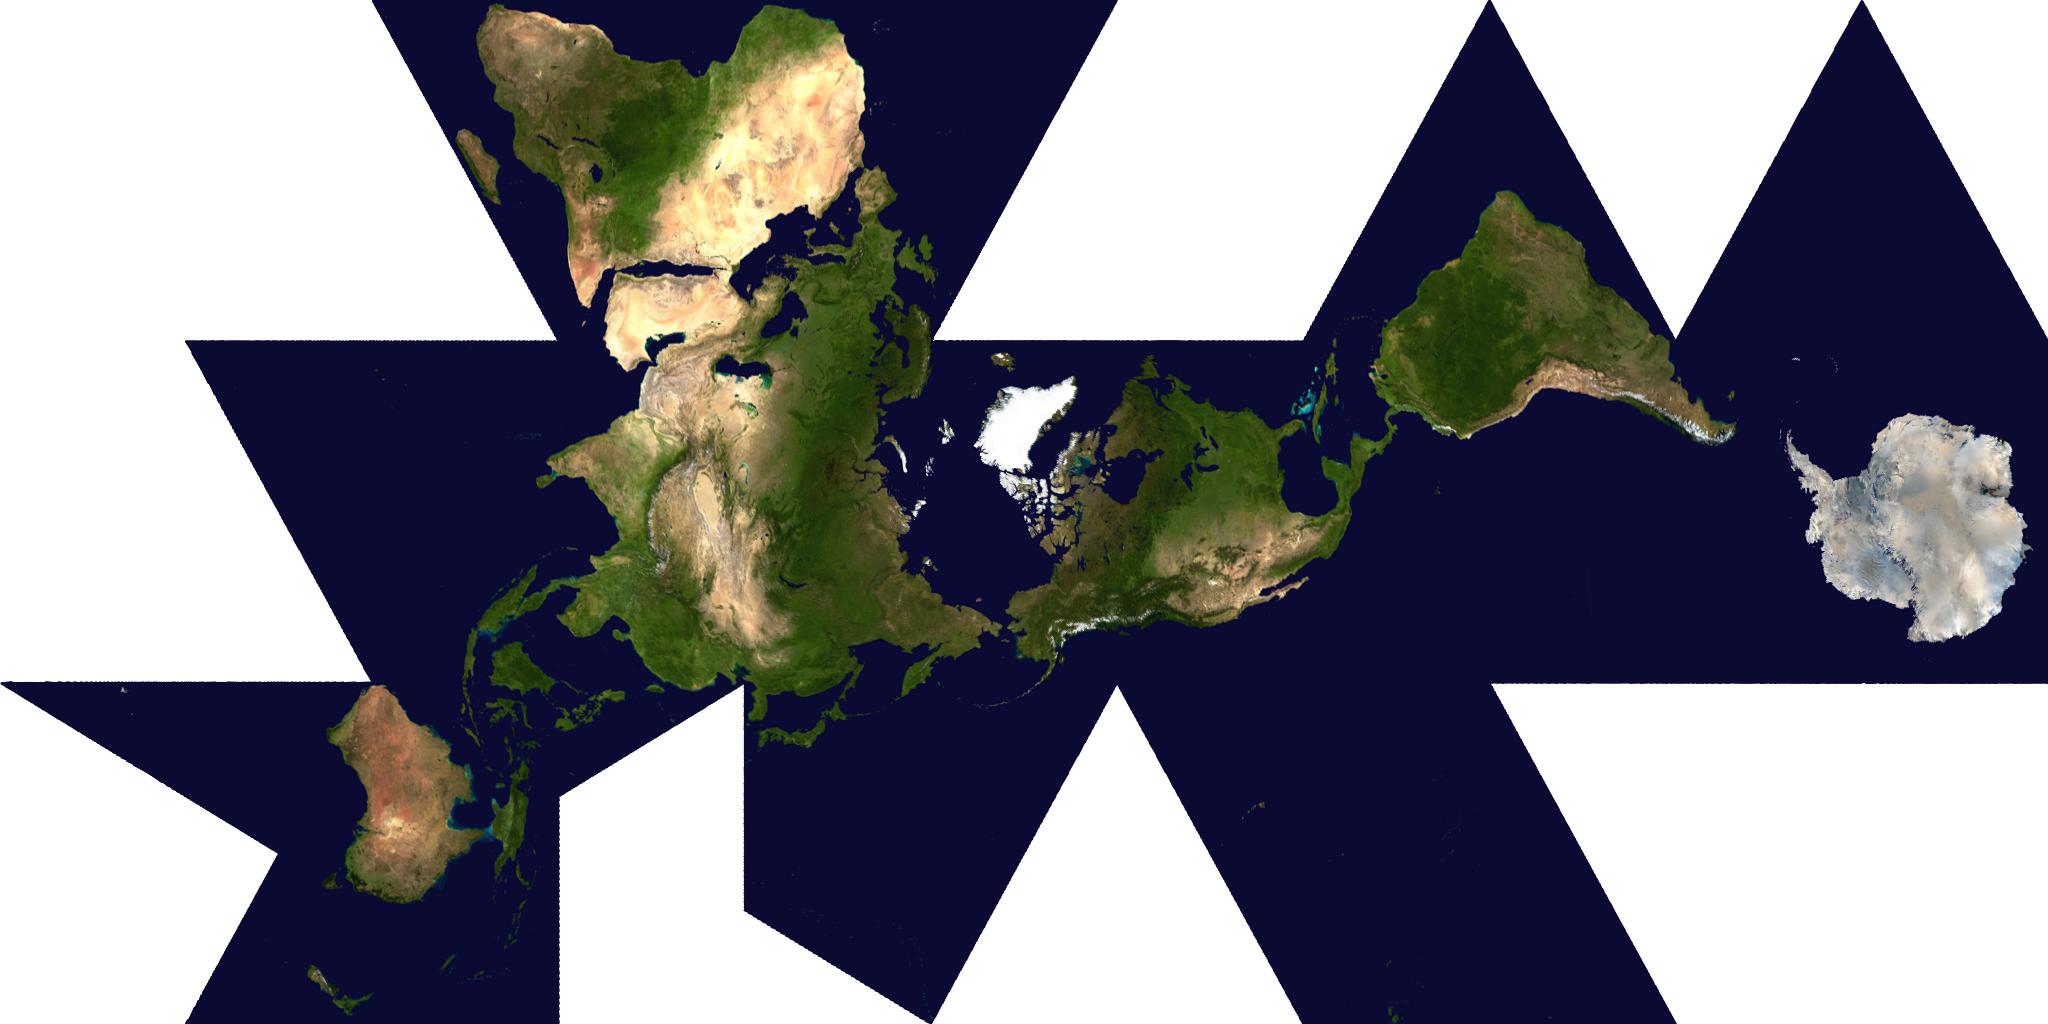
Dymaxian map by Buckminster Fuller Large
New 3D earth images11/10
The most and least remote places in the world. Surprisingly less than 10% of the world's land is more than 48 hours of ground-based travel from the nearest city. Amazon? Two days.
New 3D maps from new satellites.
Representing Earth is an NYU course that investigates the potential of recreating the earth in images, VR etc.
Blaise Agüera y Arcas is the architect of Bing Maps at Microsoft, building augmented reality into searchable maps. He's also the co-creator of Photosynth, software that assembles static photos into a synergy of zoomable, navigatable spaces.
Currently mostly San Franciso Bay Area content
Care2 gives various kinds of eco and demographic info based on geography.
If the world's population lived in one city (different densities).
Open Greenmap a collective effort to show eco-info. A related concept is using maps for crises, as was done in Haiti. An extension of that is peace-mapping. Related: Safecast is open source crowd-sharing site for tracking radiation in Japan, but could be expanded.
Books about maps (not necessarily green) at Amazon including Radical Cartography andYou Are Here: Personal Geographies and Other Maps of the Imagination
Else/where : mapping new cartographies of networks and territories / Janet Abrams + Peter Hall, editors Minneapolis, MN : University of Minnesota Design Institute : Distributed by University of Minnesota Press, c2006 View contents online S&E Stacks GA139 .E48 2006
Bio-Diversity
National Geographic has biome map and one of 200 hotspots designated by WWF.org.
Mannahatta Project. Eric Sanderson pictures New York -- before the City. 400 years after Hudson found New York harbor, Sanderson shares how he made a 3D map of Mannahatta's fascinating pre-city ecology of hills, rivers, wildlife -- accurate down to the block -- when Times Square was a wetland and you couldn't get delivery. TEDtalk video.
eNature allows you to identify, track and report wildlife in your area.
Google Earth Endangered Species requires download.
Chemicals
ToxMap shows toxic waste sites in US ***
Scorecard.org allows you to see environmental hazards by maps or Zip code ****
Mapcruzin by Slug Mike Meuser ***
SkyTruth uses remote sensing and digital mapping to educate the public and policymakers about the environmental consequences of human activities, and to hold corporations and governments to higher standards of accountability around the globe. This link is to Gulf Oil Spill. They also have an interactive tool, Spill Tracker. See also fishing trawler sediment trails and oil sands.
ToxicRisk.com - Mashup Combines recent EPA Toxic Release Inventory data (03/19/2009), school locations and chemical release information with Google Maps to help you locate potentially risky toxic facilities in your community where you live, work and play and where your children go to school.
Consumption/Resources/Food
Sourcemap is an open source project about where things come from. You can add maps and info.
Worldmapper *** Very cool; shows how different countries produce and consume etc by changing relative size.
Find good food by place via Eatwell Guide, see also another tool Eat Local shopws where to get local food and how to get there.
A tool that maps and grades "food deserts" to lure supermarkets.
Walkscore.com tells you how walkable a neighborhood is.
Economics
Gapminder has astonishing info by country, over time, and the ability to do comparisons. See truly excellent TEDtalks.
New tool maps and grades "food deserts" to lure supermarkets.
How climate change will affect migration in Mexico, in India, in Viet Nam, and in Egypt. See full UN report.
Energy
Solar Incentive US map, Oregon's pilots of a solar highway (and other useful graphs and info).
Time lapse images of mountaintop coal removal.
Wind Map tells where it's feasible to use it as a power source.
Forests
urban tree map of San Francisco, is part of larger open data initiative that helps with mass transit and recycling by providing mobile apps.
First-of-its-Kind Map Depicts Global Forest Heights
Global Warming/Air Pollution
CAKE map of projects adapting to climate change. CAKE is a joint project of Island Press (Slug!) and EcoAdapt. It is aimed at building a shared knowledge base for managing natural systems in the face of rapid climate change. NEW!
How climate change will affect migration in Mexico, in India, in Viet Nam, and in Egypt. See full UN report.
Rising Ocean Levels interactive maps.
UN map of Africa showing effects of Global Warming. Atlas
Google Earth Climate Change maps.
EPA Criteria Pollutants - (Google Earth )Mapped by facility and tons of criteria pollutants released to the air. Criteria pollutants include carbon monoxide, nitrogen oxides, sulfur dioxide, volatile organic compounds, particulate matter < 10 micrometers, particulate matter < 2.5 micrometers. From Mike Meuser, Slug.
Water
Where does your water come from?
Ocean
Santa Cruz Watershed info map
Rising Ocean Levels interactive maps
Sylvia Earle on Google Earth 5 mapping the oceans. Interview here's a sample
Interactive map of marine dead zones
Whale ship collision map Boston shows how these could be avoided.
Coral reef watch in Google Earth.
Google Earth/3D
Google Earth allows you to fly over a globe and look at information people have posted. The software is free, but you need reasonable graphics on your computer to run it.
Google Earth Engine is an online environment monitoring platform that makes available to the entire world a dynamic digital model of our planet that is updated daily. It stores petabytes of satellite data and allows high-performance tools to analyze and interpret this information that can then be visualized on a map, ranging from rainforest changes in the Amazon to water resources in the Congo.
List of many eco sites using GE ***
Endangered Species requires download.
EPA Criteria Pollutants - (Google Earth )Mapped by facility and tons of criteria pollutants released to the air. Criteria pollutants include carbon monoxide, nitrogen oxides, sulfur dioxide, volatile organic compounds, particulate matter < 10 micrometers, particulate matter < 2.5 micrometers. From Mike Meuser, Slug.
Investigate climate change via Google EarthGoogle Earth guided tour of global warming impacts.
Google Earth stops mountaintop removal
North American Environmental Atlas uses various tools, including Google Earth.
UCSC Ecology Dept is using Google Earth to map research on Bristlecone Pine.
Google Earth map of endangered species
UN Google Earth maps of global climate change and its effects
Google Earth maps of Appalachian mountaintop removal in coal mining
Jane Goodall's work with chimpanzees
California
UCSC
We make maps at UCSC at the The Center for Integrated Spatial Research (CISR), formerly the GIS/ISC Laboratory, is the central facility for spatially-focused research and training at the University of California, Santa Cruz. CISR is focused on integrating state-of-of-the-art spatial technology and methods (geographic information systems, global positioning systems, remote sensing, spatial modeling/statistics) with pressing interdisciplinary research and fostering cross-domain cooperation in the application of these tools., for example of The Farm